Chasing Devin's /stats Command: Tokens, Turns, and a Very Patient expect Script
There’s a moment when you’re deep in a Devin session and you type /stats out of curiosity, and it just… works. Tokens in. Tokens out. Number of turns. Right there in the session. If you’re the kind of person who’s already thinking about per-ticket AI effort measurement — and I am, because that’s a whole other post — your first instinct is: I need to capture this from my orchestration script.
That instinct, it turns out, is easier said than done.
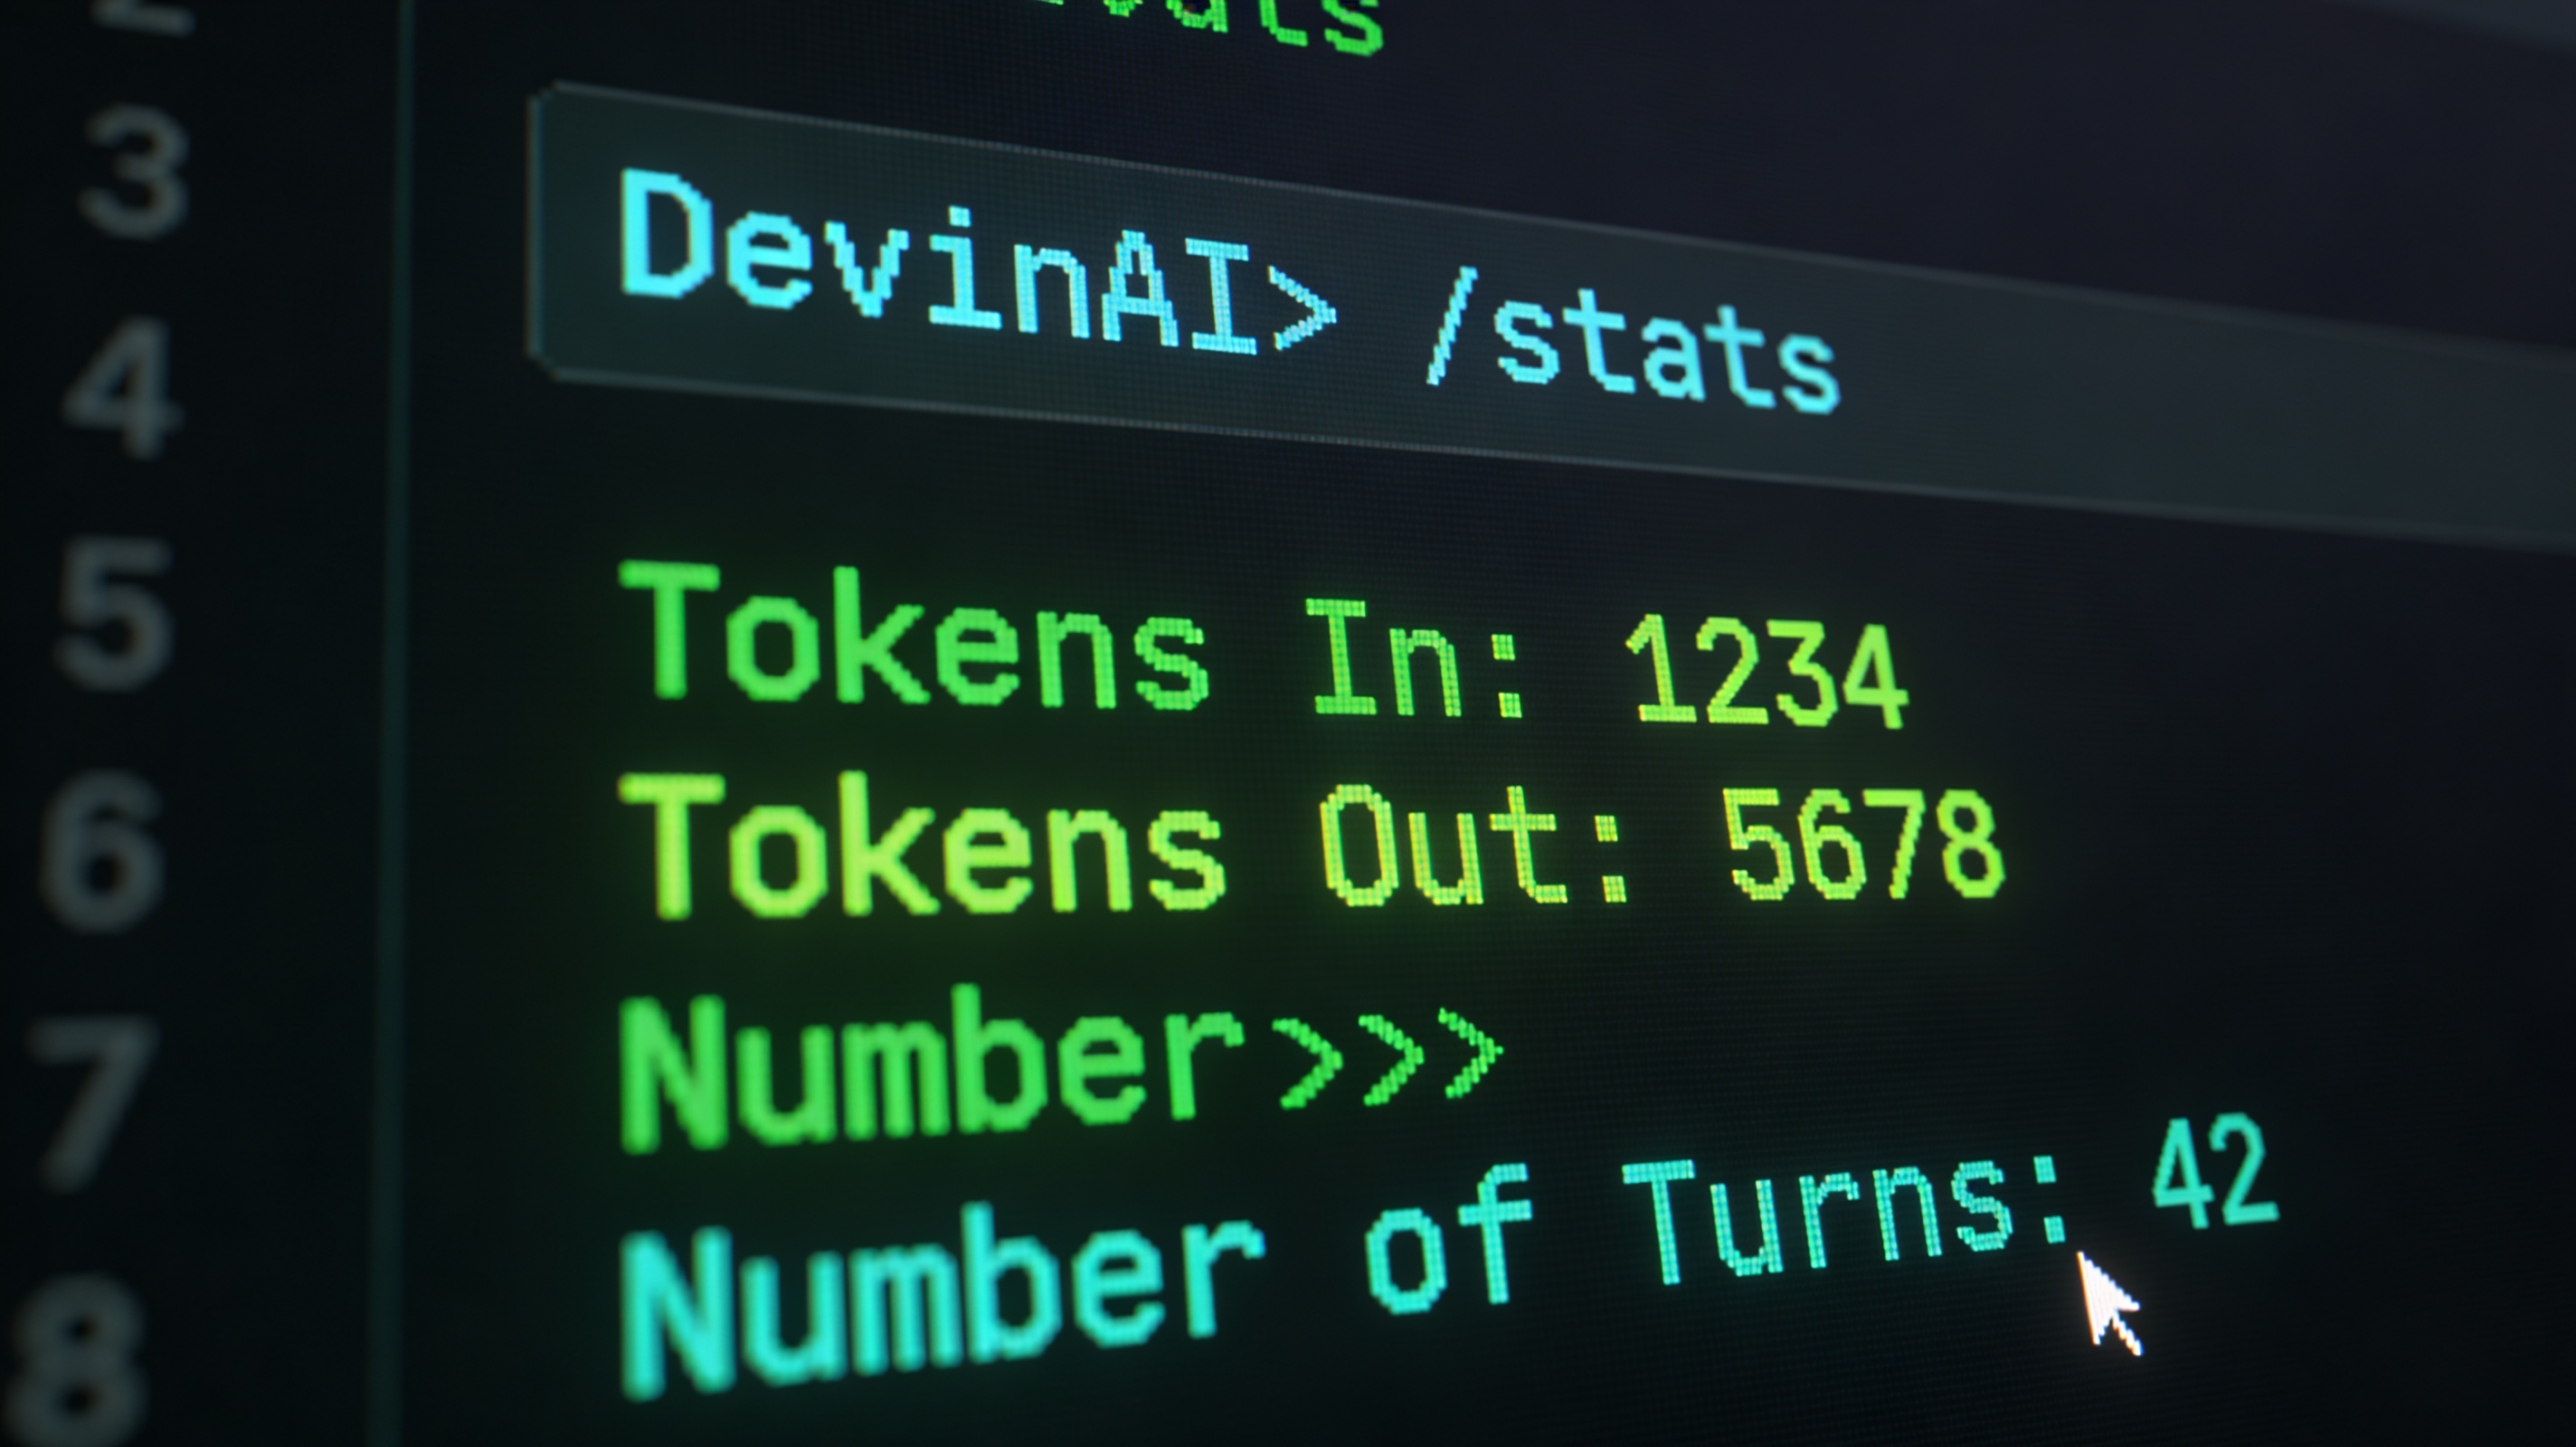
What /stats actually shows
The output is clean and genuinely useful: how many tokens went in, how many came out, and how many conversational turns the session took. For a one-shot structured prompt session, that maps naturally to cost and complexity. A 10-turn session that burned 80k tokens tells a different story than a 3-turn session at 12k. Combined with the ACU metric Devin exposes in its session database, you’d have a pretty complete picture of what each Jira ticket actually cost in AI terms.
The catch is that /stats is a Devin-native slash command. It’s not a shell command, it’s not a flag, and it doesn’t write to a file. It speaks to Devin’s internal session interface — which is great when you’re sitting at the keyboard, and a problem when you’re trying to pipe it through Python.
Attempt 1: Python subprocess
My orchestration script already calls Devin sessions via Python using subprocess. The natural first approach was to send /stats as a final message at the end of the session and capture stdout:
import subprocess

result = subprocess.run(
    ["devin", "--one-shot", "/stats"],
    capture_output=True,
    text=True
)
print(result.stdout)
Nothing. Empty stdout. The command ran without error, but /stats output simply doesn’t go to the process’s stdout — it goes to Devin’s own session stream, wherever that is. Piping through Python means you’re listening on the wrong channel entirely.
Attempt 2: expect
If Python’s pipes couldn’t see it, maybe expect could — expect works at the terminal/pty level, so it should be able to see anything that appears on screen:
#!/usr/bin/expect -f
set timeout 30
spawn devin
expect ">"
send "/stats\r"
expect "Tokens"
puts $expect_out(buffer)
Good news: expect successfully sent the /stats command and Devin received it. Bad news: the script then just… sat there. The expect "Tokens" match never fired. Either the output format didn’t match, or /stats output lands somewhere that even the pty can’t see it — possibly rendered directly into Devin’s UI layer rather than written to the terminal buffer.
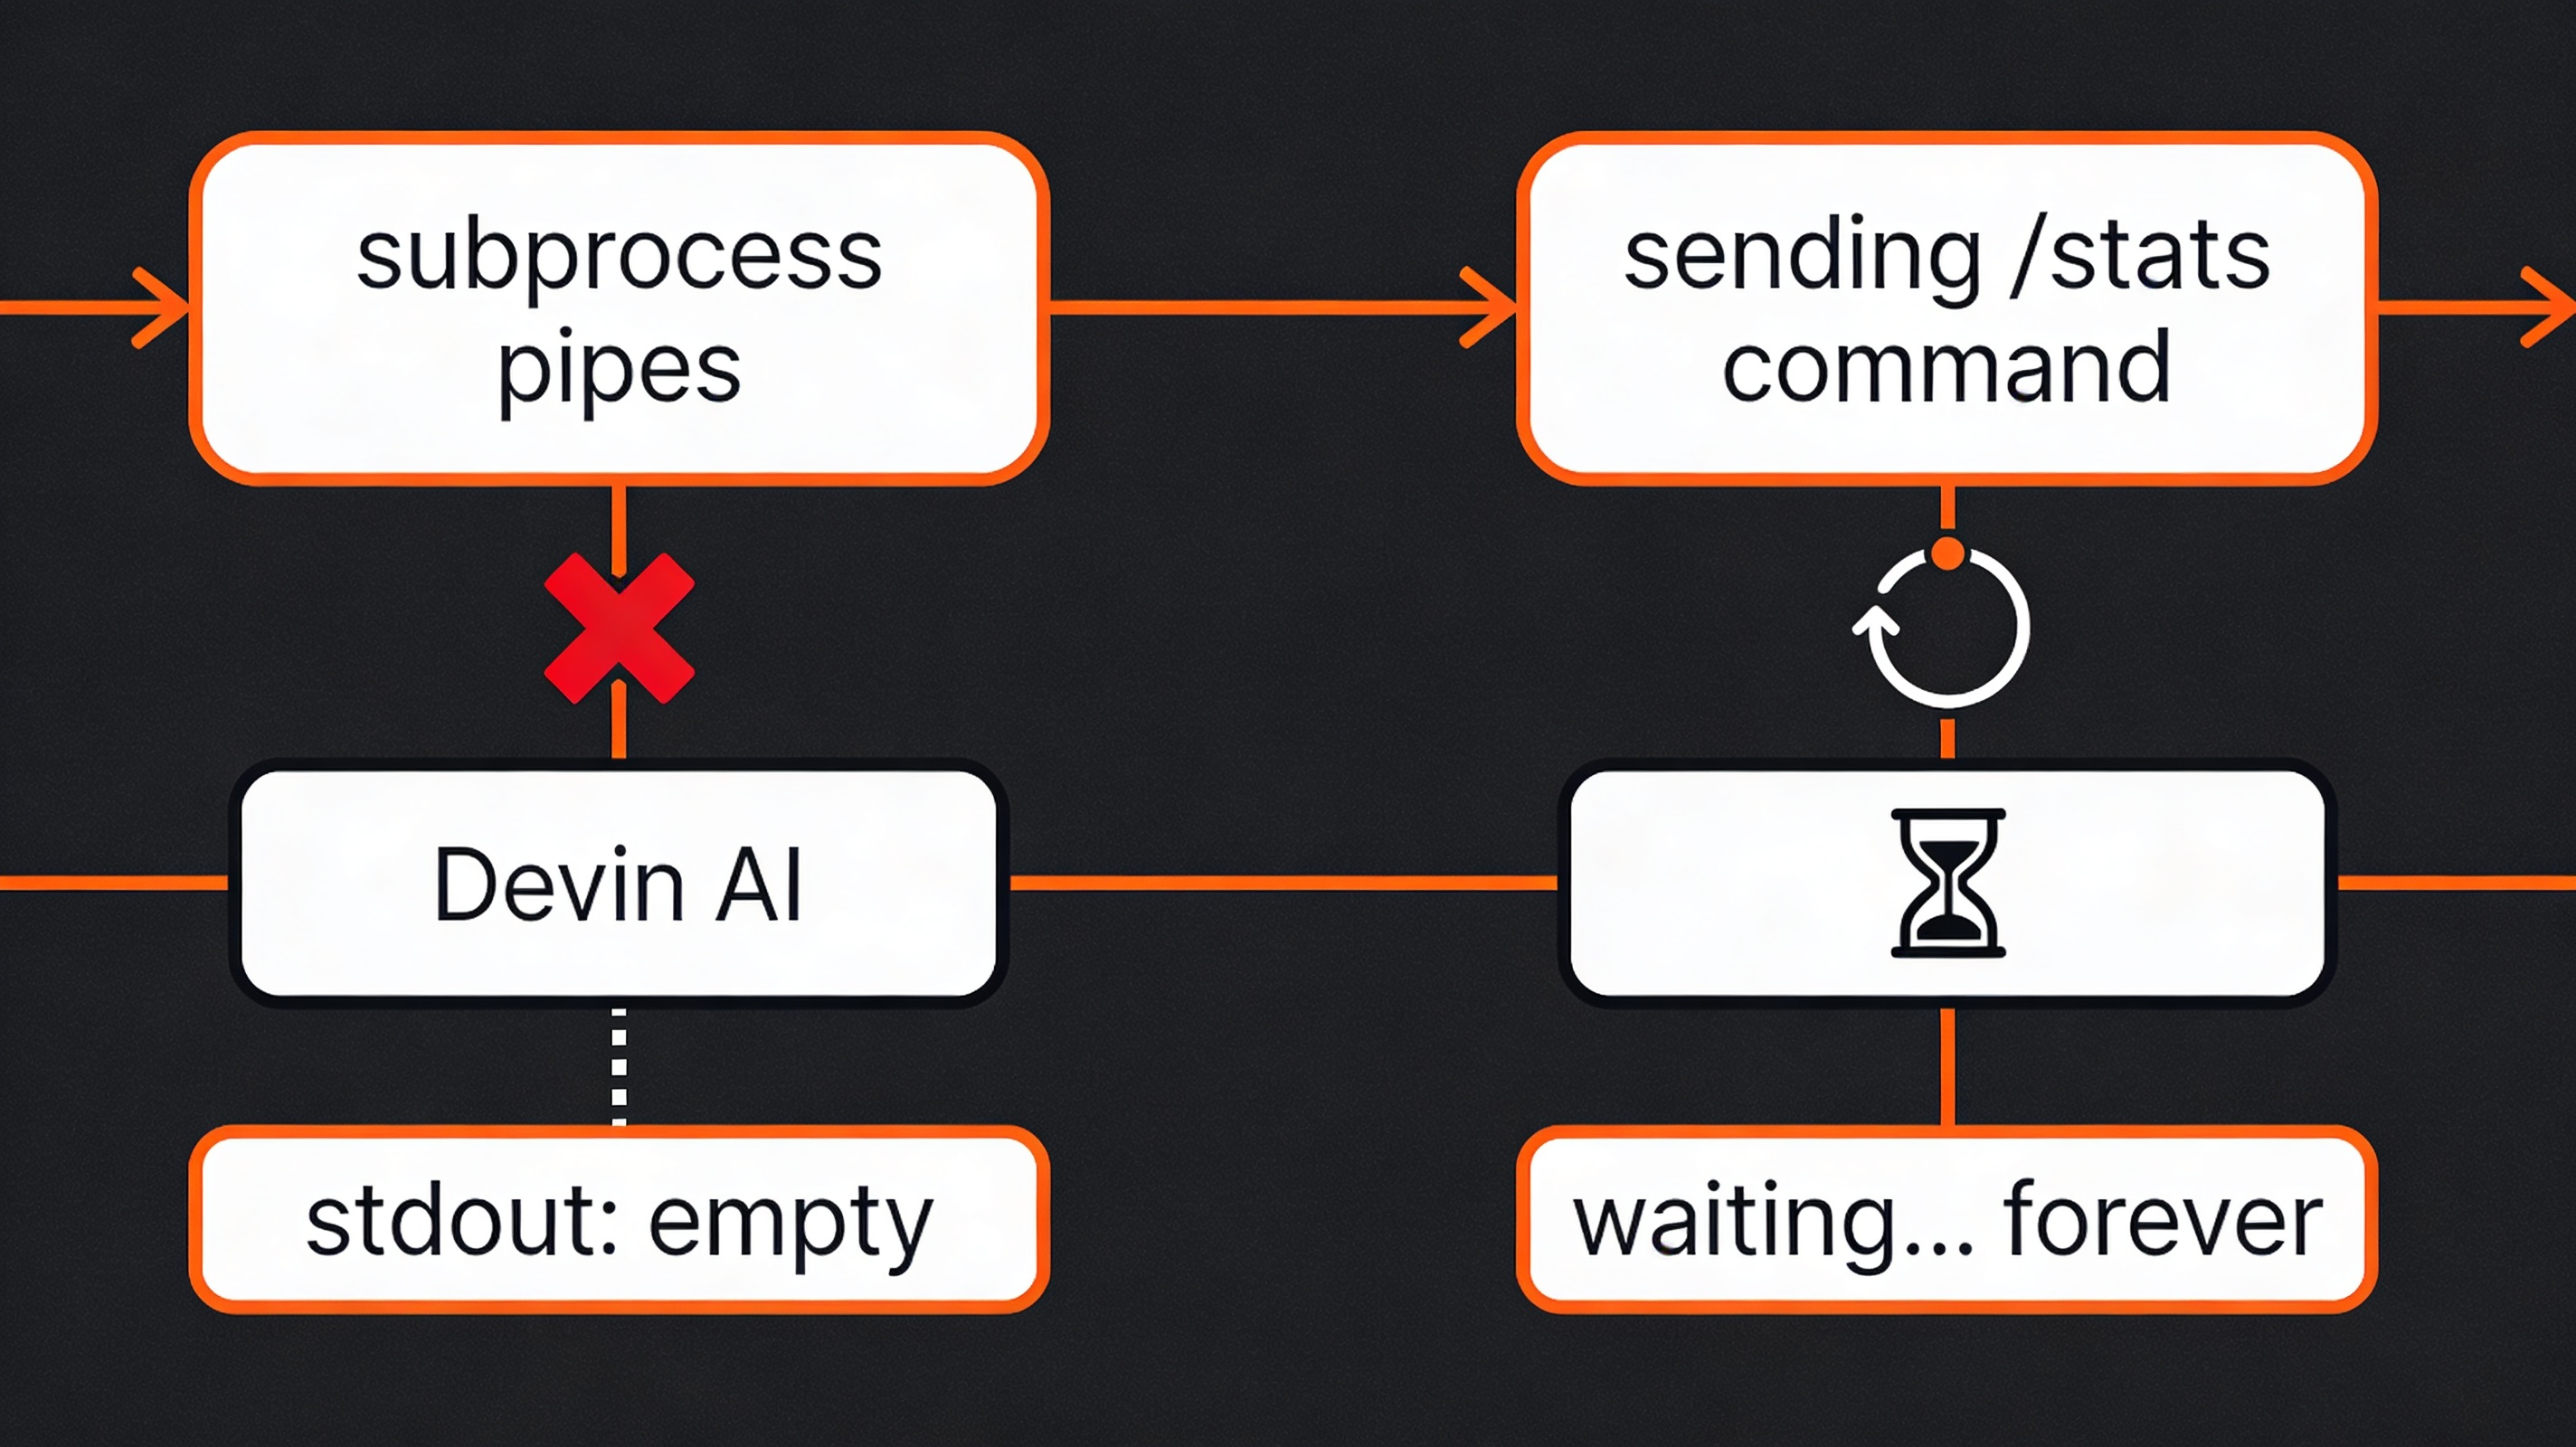
I let it sit for a few minutes, then gave up.
Why this happens
The most likely explanation is that /stats output is written to Devin’s internal session UI stream — the same place the chat interface renders its responses visually — rather than to stderr or stdout of the underlying process.
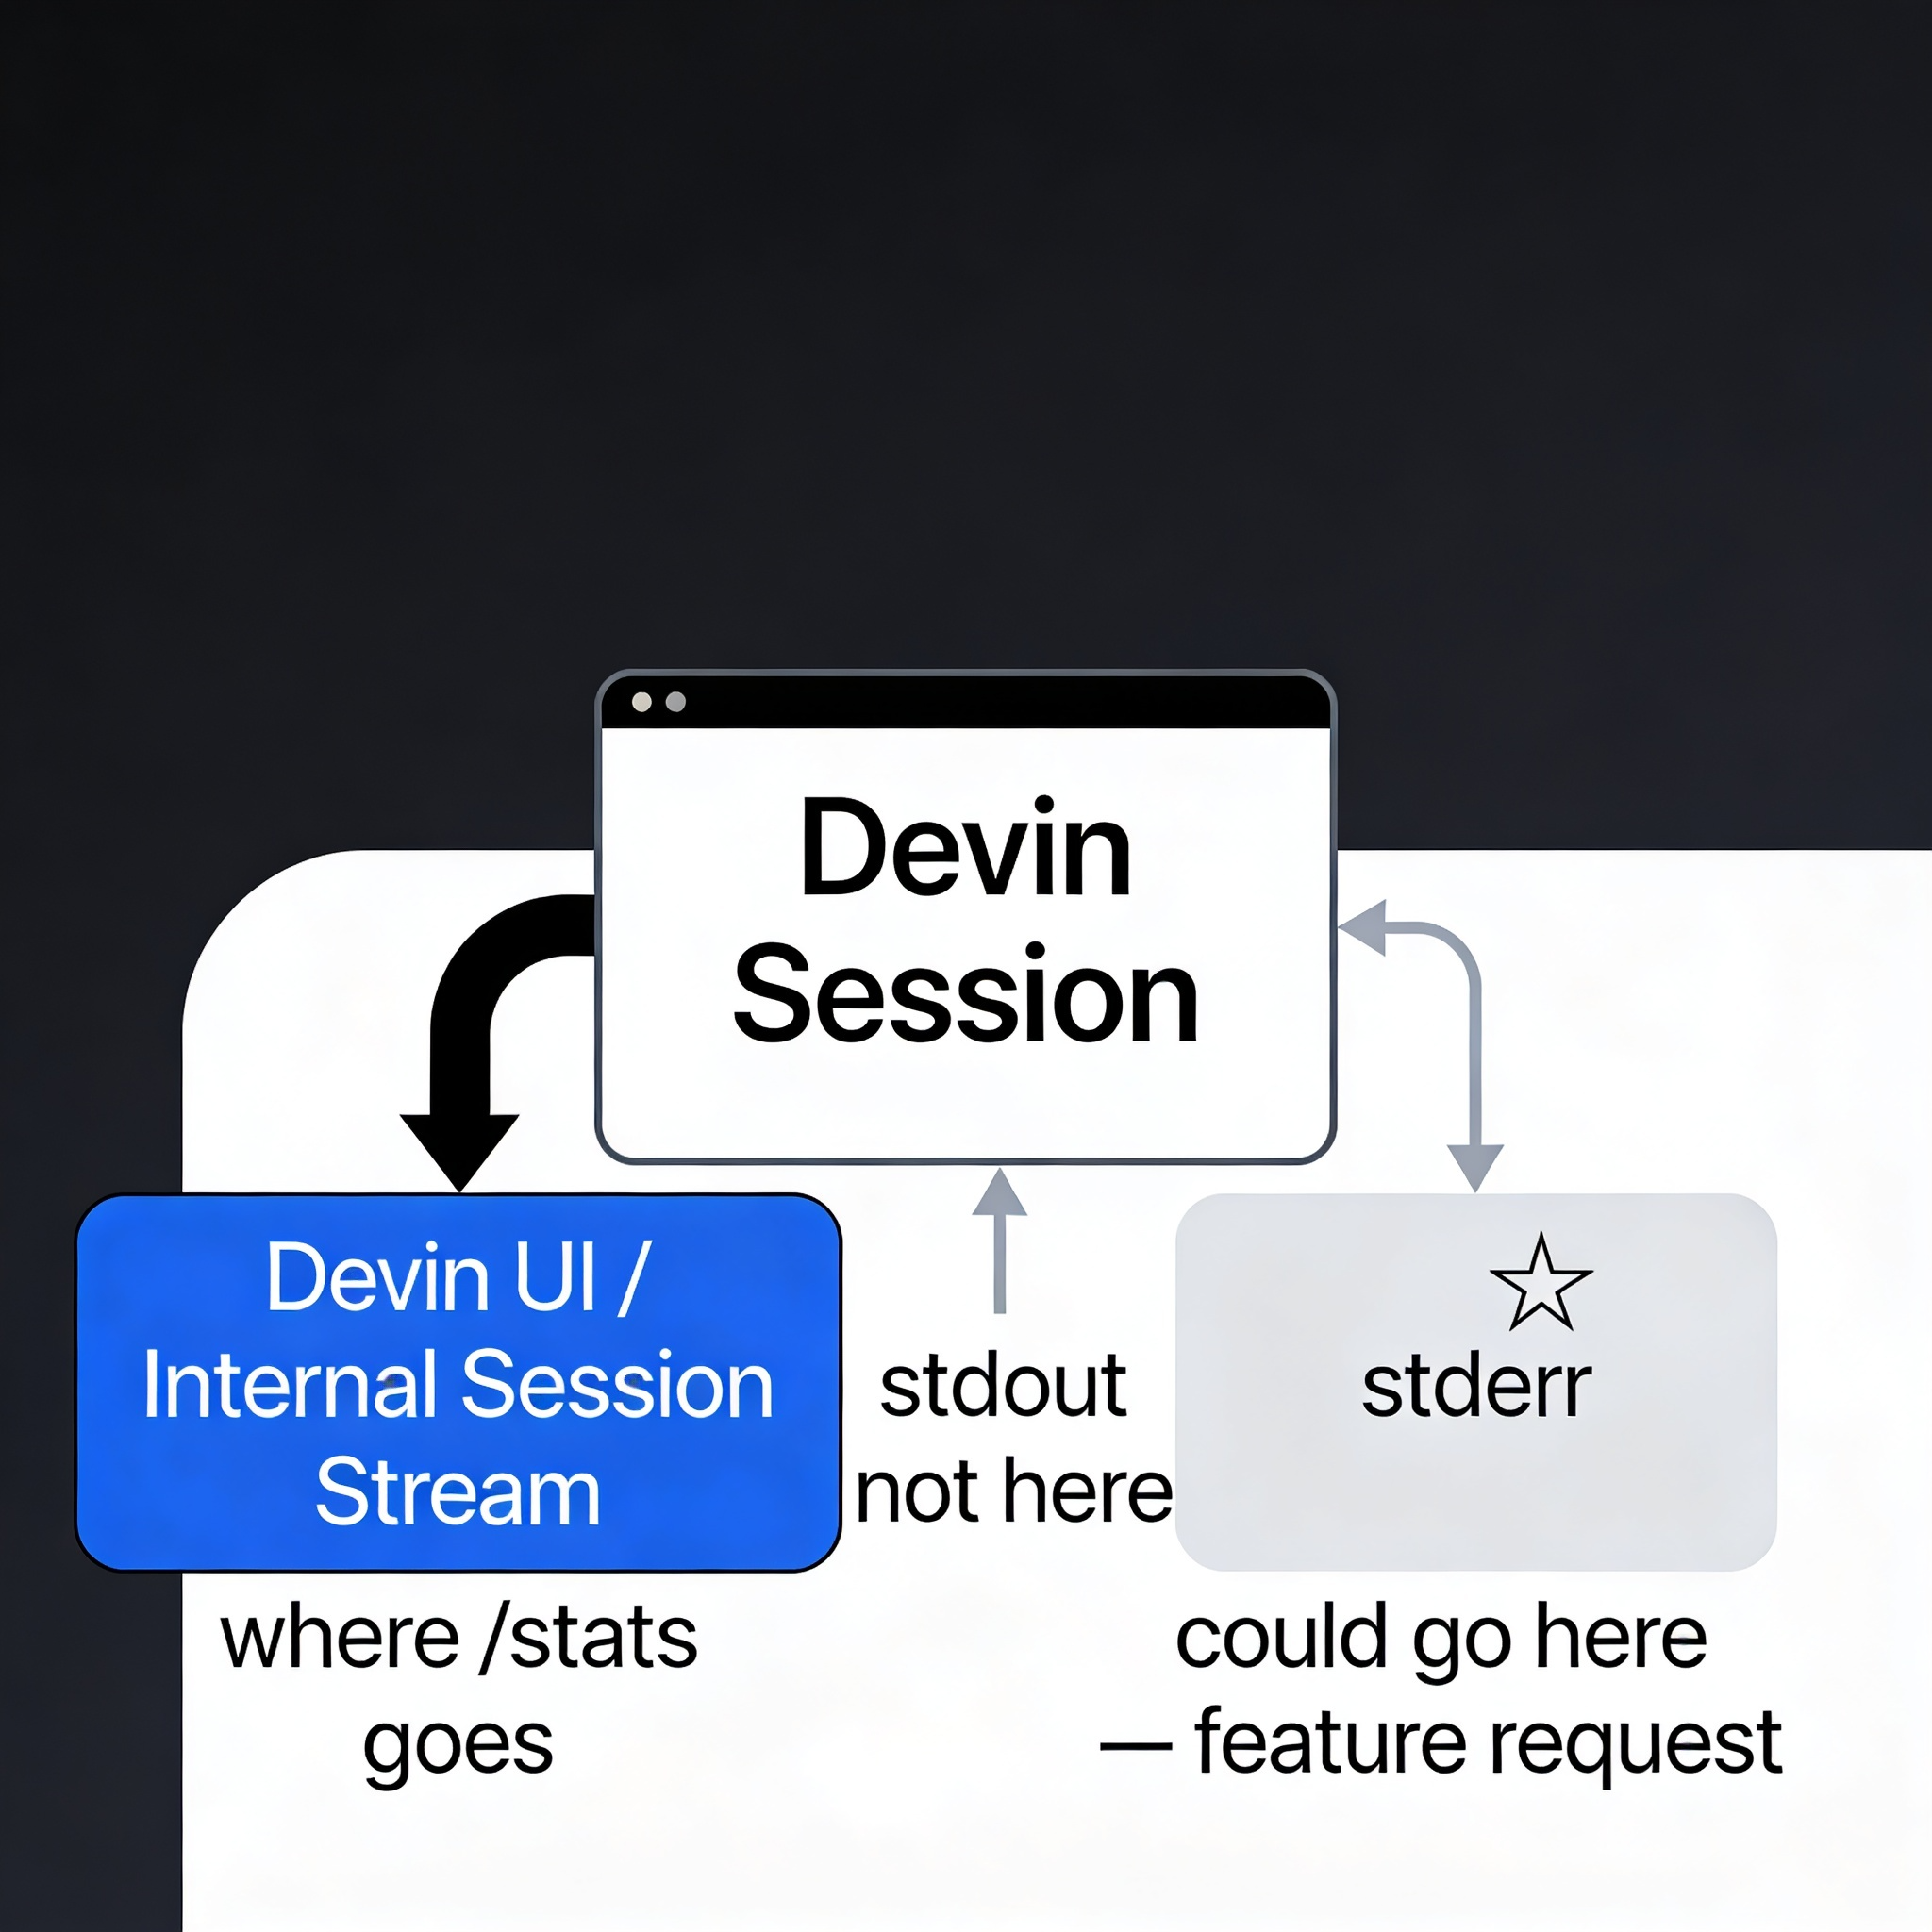
This is a reasonable design decision for an interactive tool, but it’s a dead end for external orchestration. There’s no clean seam to hook into.
The feature request
The fix is simple from Devin’s side: output /stats results to stderr. That would make it trivially capturable from any external script:
result = subprocess.run(
    ["devin", "--one-shot", "do the thing"],
    capture_output=True,
    text=True
)
# Parse stats from stderr after session ends
stats = parse_stats(result.stderr)
No expect, no pty tricks, no polling a session database. Just stderr. If you’re reading this and you work on Devin — this would be a small change with a big quality-of-life improvement for anyone building orchestration scripts on top of it.
If you’re on Enterprise
There is a proper API-based solution, but it requires an Enterprise plan. The /beta/v2/enterprise/sessions/{session_id} endpoint returns session details including ACU consumption data — which covers the same ground as /stats and is designed for exactly this kind of programmatic access. If you’re already paying for Enterprise, the per-ticket metrics story becomes much cleaner: call the API after each session, log the results, done.
For everyone else on Core or Teams, the options are: read the session database directly (which I’m doing for the ACU metric), wait for the stderr improvement, or accept that /stats is a manual command for now.
What I’m doing instead
For the time being, I query Devin’s local session database directly for the ACU metric and correlate it with worktree directories to get per-ticket AI effort. It’s not as clean as /stats output, but it works without any terminal gymnastics. The full story on that approach is in Measuring What Your AI Actually Does.
The /stats adventure was a dead end, but it was an instructive one. Sometimes the most useful thing you can learn is exactly where the seam doesn’t exist yet.
This post is part of a series on structured AI-assisted development workflows. Start with Git Worktrees: The Missing Piece or read How Structured Prompts in Devin Transform Both Code Generation and Review.
This post was drafted with the assistance of Perplexity AI, based on my own first-hand experience. All technical details, workflow decisions, and opinions are my own.